



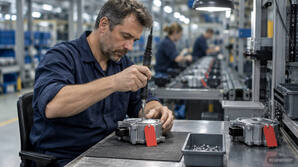
At the end of the shift, the report shows 2,000 good parts. What the report doesn’t show: 90 of them ended up at the rework station at some point; two coworkers took them apart, reassembled them, and inspected them again. Everything is shipped out anyway, and that is precisely why rework goes unnoticed in many plants. Anyone who wants to reduce the rework rate must first make it visible and then address the root causes rather than focusing on the rework station.
KEY POINTS AT A GLANCE
|

IN SHORT
|
What is the rework rate, and how is it calculated?
The rework rate indicates the percentage of parts that must be reworked after the first run in order to meet requirements. It is expressed as a percentage or, particularly in the automotive industry, as a value per 1,000 parts:
Rework rate in % = reworked parts ÷ produced (or inspected) parts × 100
The DIN EN ISO 9000:2015 standard distinguishes between two terms that are often conflated in the workplace. Rework (3.12.8) brings a defective product up to a standard where it meets the requirements. Repair (3.12.9) merely makes the product acceptable for its intended use and does not necessarily meet all requirements. This distinction is important for the key performance indicator: Repaired parts must be counted separately because, depending on the customer, they may require special approval.
Comparison of Rework Rate, Scrap Rate, and First-Pass Yield
| Metric | Formula | What it indicates | What it hides |
|---|---|---|---|
| Scrap Rate | Rejected parts ÷ Parts produced × 100 | Total losses in material and value added | Parts saved through rework |
| Rework rate | Reworked parts ÷ parts produced × 100 | Capacity spent on corrections | Whether the rework was successful |
| First-Pass Yield (FPY) | (Parts produced minus scrap minus rework) ÷ parts produced × 100 | Percentage of parts that are acceptable on the first pass | Where in the process the defect originated, if it developed over multiple steps |
A sample calculation illustrates how different the three values can be. A production line manufactures 10,000 assemblies. Of these, 420 require rework, and 80 end up as scrap. The scrap rate is 0.8 percent and appears unremarkable. The rework rate is 4.2 percent, and the first-pass yield is 95.0 percent. Only the last two figures reveal that one out of every twenty parts did not pass through the process correctly on the first try.
The article “KPI Design for Quality Managers” describes how to structure key performance indicators so that they support management decisions.
|
20 to 40% of the total capacity of many companies is tied up in the “hidden factory” that corrects defects, according to Armand Feigenbaum Source: Feigenbaum, “Concept of the Hidden Plant,” based on Industry Week (1994) |
Factor of 10 the cost of correcting a defect increases for each phase in which the defect remains undetected Source: Rule of Ten for error costs according to VDI 2247 |
3.12.8 Definition of rework: Action taken on a defective product to ensure it meets the requirements Source: DIN EN ISO 9000:2015 |
8.7.1.4 Risk analysis prior to any rework and documented evidence regarding quantity, decision, date, and traceability Source: IATF 16949:2016 |
Why does rework cost more than the rate suggests?
Rework does not appear as a loss in any material balance sheet, because the part is ultimately shipped. The costs lie in labor time, inspection time, handling, floor space, and the capacity lost from the regular production cycle. Quality pioneer Armand Feigenbaum called this area the “hidden factory.” According to his assessment, reported by Industry Week magazine in 1994, rework ties up 20 to 40 percent of total capacity in many companies.
What Makes Up Rework Costs
| Cost Component | What is incurred |
|---|---|
| Labor time | Disassembly, correction, and reassembly at the rework station |
| Inspection | Repeat inspection according to the inspection plan, often using our own testing equipment |
| Materials | Replacement parts, screws, gaskets, consumables |
| Logistics | Outflow, buffering, inflow, labeling |
| Capacity | Missing good parts per cycle, special shifts, rescheduled orders |
| Documentation | Records of decisions, quantities, dates, and traceability in accordance with IATF 16949 |
Added to this is the timing of detection. The “rule of ten” for defect costs, as outlined in VDI Guideline 2247, states that the cost of correcting a defect increases tenfold with each phase through which the defect passes undetected. Rectifying the issue directly at the workstation therefore costs significantly less than a customer complaint.
|
Calculation Example: What 4.2 Percent Rework Entails Let’s stick with the production line producing 10,000 assemblies and 420 rework cases. If each case takes an average of 15 minutes, including a re-inspection, that amounts to 105 work hours for a given production volume. For a monthly volume of this magnitude, that corresponds to roughly two-thirds of a full-time position—dedicated solely to corrections. These figures are merely an example; feel free to substitute your own times and quantities. |
What factors drive rework in manufacturing?
Rework is the result of a process that allowed a defect to occur or detected it too late. The Ishikawa diagram’s classification of influencing factors is a useful framework for analysis. The table supplements this with typical examples from the assembly process.
| Influencing factor | Typical Cause | Example |
|---|---|---|
| Human | Mixing up variants, missing work step, unclear work instructions | Wrong screw for a rare variant |
| Method | Inspection only at the end of the line, outdated work instructions | Error is discovered three stations later |
| Machine | Tool wear, incorrectly configured screwdrivers, drift in measuring equipment | Torque within tolerance range, rotation angle abnormal |
| Material | Tolerance variations in purchased parts, batch with a different surface finish | Threads seized in a specific supplier batch |
| Measurement | Test equipment incapable of measuring; limit values too narrow or too wide | False defects lead to unnecessary rework |
| Environment | Temperature, contamination, lighting at the workstation | Visual inspection is less effective during the night shift |
Two causes are often overlooked. First, pseudo-defects: If a testing device is not capable or if tolerance limits are set incorrectly, flawless parts end up in rework. Second, human errors that are actually process errors. If a worker selects the wrong step among 40 possible variations, the cause usually lies in the information missing at the workstation. More on this can be found in the article “Human Error as a Source of Defects.”
|
WHITE PAPER Management of Quality-Relevant Production Data The rework rate can only be reduced if process data, error types, and serial numbers match. This white paper shows how to structure quality-related production data so that every instance of rework can be traced back to its cause. |
How do you measure the rework rate in a way that makes it manageable?
A rework rate that appears only as a monthly figure in the quality report cannot be managed. It becomes manageable only when each case is recorded in such a way that it can be assigned to a workstation, a defect type, and a specific time.
This data is associated with every rework case
- The part’s serial number or lot number, so the case aligns with the process history.
- The workstation and process step where the defect occurred—not just the location where it was discovered.
- Defect type from a standardized defect catalog instead of free text.
- Timestamp, shift, variant, and the tool or equipment used.
- Result of the re-inspection and the decision: acceptable part, repair with approval, or scrap.
For automotive suppliers, some of this is mandatory anyway. IATF 16949 requires, in Section 8.7.1.4, that risks be assessed using a method such as FMEA before a decision on rework is made, and mandates documented information on the quantity, decision, date, and traceability of the reworked parts. If the customer requires it, the rework must be approved by the customer beforehand.
Also, measure the rework rate per process step, not just for the entire line. An overall rate of three percent could consist of a single station with a twelve percent rate and many stations with low rates. Calculating an average then obscures exactly where the effort is most worthwhile.
What methods reduce the rework rate?
Methods for reducing rework differ depending on whether they prevent errors, detect them earlier, or simply correct them more effectively. The first four methods in the table are applied directly within the process. The last three help prioritize areas and permanently eliminate root causes.
| Method | Principle of Operation | Typical Application |
|---|---|---|
| Poka Yoke | Make errors technically impossible | Coded connectors, part recognition before assembly |
| Digital operator guidance | Preventing errors through accurate information at the workstation | Highly Varied Assembly, Training of New Employees |
| Statistical Process Control (SPC) | Detect process drift before tolerance limits are exceeded | Screwing, pressing, and joining processes with continuous measurement data |
| Real-time process data monitoring | Detect deviations at the source and immediately block the part | Screw connections, leak testing, and adhesive bonding processes |
| Pareto analysis | Identify the few defect types with the highest incidence | Prioritizing improvement projects |
| 8D Method | Systematically eliminate the cause and demonstrate effectiveness | Recurring defects, customer complaints |
| Root cause analysis using the 5 Whys and Ishikawa diagram | From the type of error to the root cause | Workshops with Production, Quality, and Maintenance |
In practice, these methods are interlinked. The Pareto analysis shows where to start. Using the 5 Whys and Ishikawa diagrams, the team identifies the root cause, and Poka-Yoke, worker guidance, or SPC ensure the result is embedded in the process. There is a separate article on evaluating process capability using Cpk and Ppk: Calculating and Interpreting Cpk and Ppk. To learn how digital operator guidance helps with errors and training, see Digital Operator Guidance: Reducing Errors.
How can you reduce the rework rate in six steps?
The following six steps will take you from a vague monthly metric to a rework rate that consistently decreases. Each step has a measurable outcome.
| Step | Content | Result |
|---|---|---|
| 1. Standardize data collection | Define a list of errors; implement case-by-case tracking using serial numbers, workstations, and error types | Reliable data foundation from day one |
| 2. Determine Baseline | Measure the rework rate and FPY per station over at least four weeks | Reference value for later impact assessment |
| 3. Set priorities | Conduct a Pareto analysis by error type and workstation; evaluate rework time by error type | List the three defect types requiring the most effort |
| 4. Analyze causes | 5. Use the 5 Whys and Ishikawa diagrams as a team; compare with process data for the affected parts | Identified cause for each defect type |
| 5. Implement measures | Prevent defects (Poka Yoke, operator guidance) or detect them early (SPC, real-time monitoring) | Measure effective within the process |
| 6. Verify effectiveness | Compare the key performance indicator to the baseline value, update the FMEA and inspection plan, and display the results on the shop floor board | Verified reduction and documented standards |
Step 4 requires the most care. Even if a team finds a plausible explanation and implements a corrective action, the defect type may still reappear three weeks later. Cross-checking with the process data for the affected serial numbers prevents this: If the suspected cause cannot be verified in the data, it is likely not the correct one.
“A corrective action to prevent rework is only effective if the defect type no longer appears in the data from the following weeks.”
Guideline for verifying effectiveness
How does process data help with root cause analysis?
In automated and semi-automated processes, each station generates measurement values: torque and angle of rotation during screwing, force and displacement during pressing, and leak rate during leak testing. If this data is stored by serial number, the cause of each rework case can be traced back to its origin.
In the workshop, the team then compares the process data from the reworked parts with that of the good parts, rather than speculating about possible causes. If the defective parts all originate from a specific screwdriver, a specific shift, or after a tool change, the cause is narrowed down. For screw-in assemblies, the shape of the screw-in curve often reveals what the final value conceals. Typical curve patterns and their causes are summarized in the article “Screw-In Curves: Patterns and Causes.”
In addition, defects can be detected earlier. If a deviation is detected at the station itself, the part is rejected before further value is added. Rework takes less time and is less expensive, and according to the rule of ten, follow-up costs also decrease. For more in-depth information, see “Process Data Analysis in Quality Assurance.”
What obstacles hinder projects aimed at reducing rework?
Any of the following mistakes can slow down a project aimed at reducing rework, even if the methods are correct.
- Rework is not counted as a defect. If you only report the scrap rate, you’re overlooking the majority of the effort involved.
- The error type is recorded as free text. A hundred different phrasings cannot be analyzed.
- The defect is assigned to the location where it was discovered rather than where it originated. The corrective action is then directed to the wrong station.
- The rate is measured only for the entire line. The average masks the one station where the actual problem lies.
- Targets are unrealistic or linked to penalties. As a result, rework is concealed rather than reported, and the metric drops only on paper.
- The corrective action is not incorporated into the FMEA, test plan, or work instructions. After the next staff change, the defect returns.
The article “How Quality Management Software Reduces Assembly Errors ” demonstrates how software can help address these issues in the assembly process.
|
NEXT STEP From Metrics to Root Causes This white paper provides the data structure for a robust root cause analysis. If you’d like to first assess the capability of your processes, calculate Cpk and Ppk directly using the Cpk Calculator. |
How does the Manufacturing OS help reduce rework?
CSP’s Manufacturing OS addresses the two areas where rework occurs: the process and the workstation. The IPM module collects process data by serial number and monitors production defects in real time. The PG operator guidance system guides employees step by step through the assembly process, depending on the variant.
|
How the Manufacturing OS Helps Reduce the Rework Rate
|
For screwdriving processes, Curve Anomaly AI supplements monitoring with anomaly detection based on artificial intelligence. For more on workplace assistance systems, see the article “Operator Assistance Systems: Systematically Avoiding Quality Defects.” The article “Quality Assurance Software in Production” describes its use in production.
Frequently Asked Questions
How do you calculate the rework rate?
The rework rate is the number of reworked parts divided by the quantity produced or inspected, multiplied by 100. Example: 420 reworked parts out of 10,000 produced parts result in a rework rate of 4.2 percent. It is important that the numerator and denominator refer to the same time period and the same process step.
What is the difference between rework and repair?
According to DIN EN ISO 9000:2015, rework brings a defective product up to a standard where it meets the requirements. Repair merely makes it acceptable for its intended use, without necessarily meeting all requirements. Repaired parts therefore often require special approval from the customer.
What is the difference between the rework rate and the scrap rate?
The scrap rate counts parts that cannot be salvaged and are discarded. The rework rate counts parts that still meet the requirements after a correction. Both metrics should be tracked separately because rework ties up capacity without appearing in the scrap rate.
What is first-pass yield?
First-pass yield is the percentage of parts that are acceptable on the first run, without rework and without scrap. It is calculated as the number of parts produced minus scrap minus rework, divided by the number of parts produced. A part that has undergone rework does not count as an acceptable part.
What is a normal rework rate?
There is no universal benchmark, because the rate depends heavily on product complexity, the number of variants, and the degree of automation. A company’s own trend data per station and defect type over time is more meaningful than an industry comparison.
What does IATF 16949 require regarding rework?
IATF 16949 requires, in Section 8.7.1.4, a risk analysis—such as an FMEA—before a decision is made regarding rework. Rework must be validated according to a documented process, and the quantity, decision, date, and traceability must be documented. If the customer requires it, they must approve the rework in advance.
How can rework be reduced during assembly?
According to the “rule of ten” for defect costs, measures that prevent defects or detect them at the workstation are particularly worthwhile: poka-yoke, digital operator guidance for high-variety assembly, and real-time process data monitoring. A prerequisite is the recording of every rework instance, including the serial number, workstation, and type of error, so that the Pareto analysis identifies the correct areas of focus.
Why does the rework rate increase after a tracking system is implemented?
The measured rate may initially rise because rework that was previously corrected on the assembly line without being recorded is now becoming visible. The higher value serves as a realistic baseline against which future measures can be evaluated.
Sources
- DIN EN ISO 9000:2015, Terms 3.12.8 Rework and 3.12.9 Repair (text quoted in the Elsmar Quality Forum): https://elsmar.com/elsmarqualityforum/threads/rework-vs-repair-iso-13485-definition.31689/page-2
- IATF 16949:2016, Section 8.7.1.4 Control of Reworked Products (text cited by Advisera): https://community.advisera.com/?p=10432
- European Railway Agency (ERA), Terminology Collection: Rework according to ISO 9000:2015: https://www.era.europa.eu/era-railway-terminology-collection/rework/term/sms_safety_culture_human_and_organisational_factor
- Elsmar Quality Forum: IATF 16949, Sections 8.7.1.4 and 8.7.1.5 as stated: https://elsmar.com/elsmarqualityforum/threads/iatf-definitions-reworked-product-8-7-1-4-vs-repaired-product-8-7-1-5.69118/page-2
- AIAG: Core Tools and IATF 16949:2016 Overview: https://blog.aiag.org/core-tools-and-iatf-169492016-overview
- Wikipedia: Armand V. Feigenbaum, Concept of the “Hidden Plant” with reference to Industry Week from July 4, 1994: https://en.wikipedia.org/wiki/Armand_V._Feigenbaum
- Design Society: Possibilities and Limitations of Defect Management in Product Development, the Rule of Ten according to VDI 2247: https://www.designsociety.org/download-publication/27665/bug_or_feature_m%C3%B6glichkeiten_und_grenzen_des_fehlermanagements_in_der_produktentwicklung
- RS Components: Defect Management and the Rule of Tens for Defect Costs: https://dech.rs-online.com/web/content/discovery-portal/produktratgeber/fehlermanagement
- wirtschaftsforum: Interview with Korbinian Hermann on Curve Anomaly AI: https://www.wirtschaftsforum.de/csp-gmbh-co-kg
- DirectIndustry: Company Profile: CSP Intelligence GmbH (IPM Real-Time Monitoring of Production Defects): https://www.directindustry.com/soc/csp-intelligence-gmbh-4599583.html